Number 267 - August 2005

Effective Use Of Task Manager
by Vinny La Bash,
Sarasota Personal Computer Users Group, Inc.


   The Task Manager is a handy utility Microsoft included with Windows XP. Most of us use it either to shut down the system or to close an unruly program that's listed as "not responding". It's one of those tools that everyone knows about, but hardly anyone uses it in the way it was intended. Perhaps we can do something about that.

   Broadly speaking, the Task Manager gives you a quick picture of what your computer is doing at the moment. It shows how memory is being used, what programs or processes are currently running, and some performance indicators. Is it important to know that your System Cache just changed from 274,876 kilobytes to 274,414 kilobytes? Should you be concerned that Winword.exe is taking up 43.875 megabytes of physical memory? Let's examine some common scenarios and find out.

   You have a variety of ways to start the Windows Task Manager.

      Press Ctrl+Alt+Del
      Press Ctrl+Alt+Esc
      Right-click on an empty area of the Task Bar and select Task Manager from the popup menu.
      Left click on the Start button, select Run., type Taskmgr in the text box, and click OK.

   After invoking the Windows XP Task Manager, your dialog box should resemble the illustration. The Applications tab should be active, but if it's not, left-click it. Windows XP is likely to spot problems with an application that's crashed before you do.


   The picture shows the most common reason for bringing up the dialog box. There are two programs "Not Responding".

   Highlight the offending application(s). Click on End Task, and (maybe) respond to a series of dialog boxes asking you to send error messages to Microsoft for analysis. Some applications can be stubborn, forcing you to select End Task multiple times. Repeat until XP beats the application into submission.

   Select an application such as Inbox-Microsoft Outlook. Right-click and choose Go To Process from the shortcut menu. The task manager opens the Processes tab and selects the real process (OUTLOOK.EXE) that runs the application. This is useful when you want to analyze performance.

   If you select multiple applications from the Applications tab, you can right-click and rearrange the corresponding windows by cascading, tiling vertically or horizontally. You can also do this by right-clicking on the Taskbar, but few people remember that Task Manager also has this capability.

   Switch over to the Processes tab. You can't select multiple processes here, but you can rearrange the column order with drag and drop. Sort the CPU column in descending order by clicking on its heading. Every time you click the column heading you arrange the items in either ascending or descending order. A normal system will show that the System Idle Process appears to be hogging the computer when the system isn't doing anything. The system idle process is a sentinel process. It keeps the CPU occupied while it's waiting for something to grab its attention. Think of it as the amount of CPU power available for real work. The System Idle Process runs at the lowest priority and gets CPU cycles when nothing else is demanding attention.

   Click on the Mem Usage column to sort in descending order. This will show you how much physical RAM your applications are using. Surprising, isn't it? Work on an application while keeping the Task Manager in the foreground and watch the Mem Usage and CPU values change dynamically. If you want to conserve memory, minimize any open application that you're not using at the moment. For a dramatic example of this, open a memory intensive application like a video editing program or any program that you can load up with a large number of graphics. Then open Task Manager and check out the Mem Usage column under the Processes tab. Minimize the window, and then check the Mem Usage again. You may be amazed at the difference.

   Right clicking on any process offers several options. End Process is obvious and self explanatory. Some programs open other programs and form a Process Tree. Ending the Process Tree closes everything associated with the program you're trying to close.

   You'll get a warning message saying you may lose data and even cause system instability. Most of the time there's nothing to worry about, but be careful about ending any process that has a User Name of SYSTEM. For example, mdm.exe is associated with Microsoft Windows process debugging system. It allows the user to debug Internet Explorer errors by using a script interface tool. This is a non-essential process. Disabling this is optional and won't cause you any problems. However, attempting to end the System Idle Process is really asking for trouble. Closing down this process will shut down your system.


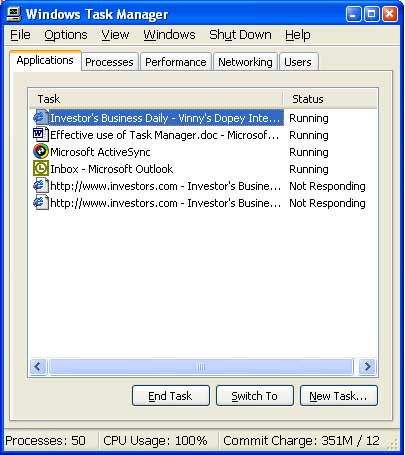
   The Set Priority option will let a program have preference using CPU cycles. Windows will devote more time to running it, but that can slow everything else down. You can play around with this option to tweak your system, but it's probably easier and simpler to shut down what you're not using.

   The best use of this tool lies in the columns of information it can display. To add or remove columns highlight Select Columns from the View menu. Choose the columns you want from the Select Columns dialog box. Let's examine some of them.


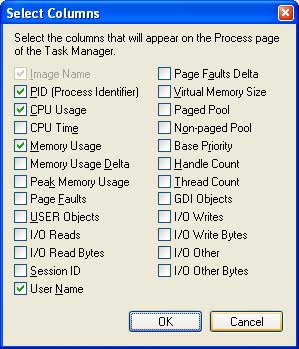
   Page Faults shows the number of times a process reads and writes to a hard disk. The system starts counting page faults from the time the process is started. If this number is high, some other process or processes may be competing with it for available RAM. High means high relative to other processes. If Page Faults indicate your memory is under stress, you may need to install additional RAM. You can often reduce the number of Page Faults by closing any applications you don't need to have running.. Base Priority decides how much processor time the program will get. You can easily see if a priority is normal, high, low or something else. Use common sense if you want to experiment with priorities. Giving too many processes high priority can hang your system. Most of the other options are meant for programmers and developers. If you don't know what they are, don't mess with them.

   The Performance tab shows how busy your PC is in typical geek fashion.. With all the talent in Microsoft, you would think they could do this in a less confusing way. The portion of the dialog box showing the CPU Usage and CPU Usage History is straightforward. The square shows the current load on the CPU, and the horizontal graph gives you its history over the last five or six minutes. You can open a program, run it for a few minutes, and then check back to see what kind of difference it makes to your performance.


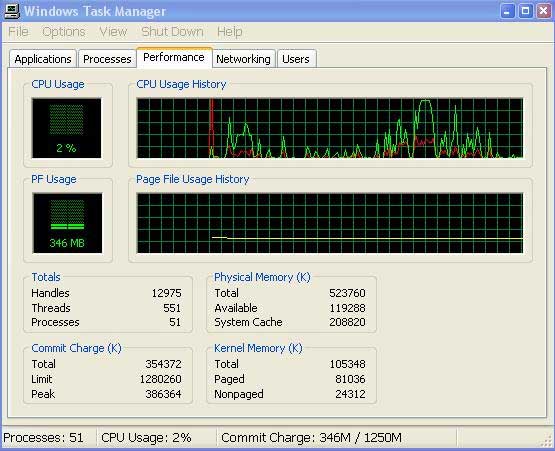
   PF Usage: This section displays what your swap file is doing. If usage is high or maxed out, increase your virtual memory. You can't do it from the Task Manager. Go to Control Panel.

   Totals: A handle is like a pointer that identifies a file or registry key so a program can have access to it. You can think of a thread as something in a process that tells a program what to do. A process is nothing more than an executable program like word.exe. Any object on your system that ends in .exe is a process. The only thing you can do to affect this is to change the number of processes running on your system.

   Physical Memory: The Total is the actual amount of RAM installed. Available is how much RAM is still left for use. The System Cache is RAM that's holding information for programs to use without having to search the hard disk. You can make some adjustments to this value by going to the Advanced tab in the Systems Properties dialog box. Then click the Settings button in the Performance area.

   Commit Charge: Talk about geek speak! This is the amount of available memory committed or charged to any programs you have running, including the Operating System. Because this section includes the virtual memory, totals may exceed the amount of physical RAM in your system. If you value your sanity, ignore this section. It's designed for bit-twiddlers.

   Kernel Memory: This is the portion of your RAM that's reserved for your operating system and device drivers. Don't even think about messing with it.

   Networking: If you have a home network, this section will show you how much information you're sending around your computers. You can see if your network is really working or how busy it gets when a web connection is made. It will show how much you stress your system when you download a file, and how much of your system resources you need to play those cool online multiplayer games.

   Users: This is where you are supposed to find out what programs the kids are running, but that's a non-starter. You really need to go to the Processes tab and check the box marked "Show processes from all users".

   This article is not an exhaustive review of every possible approach you can use to employ the Task Manager. It's simply an attempt to demonstrate some useful ways to monitor and adjust common Windows applications. Take whatever time necessary to understand how to interpret and use the information Task Manager displays, and you can easily modify portions of your system to work more efficiently.

   Copyright 2005. This article is from the May 2005 issue of the Sarasota PC Monitor, the official monthly publication of the Sarasota Personal Computer Users Group, Inc., P.O. Box 15889, Sarasota, FL 34277-1889. Permission to reprint is granted only to other non-profit computer user groups, provided proper credit is given to the author and our publication.
  Number 267 - August 2005